3 min read
A dashboard that actually knows what you're testing
Most analytics dashboards forget you run experiments. Ours has an Active Tests tab that shows every live A/B test, its leader, and whether the result is real yet.
Here is a small confession about analytics dashboards: most of them have no idea you run experiments.
You get sessions, a bounce rate, maybe a revenue line. The A/B test you launched last Tuesday? That lives in a different tool, on a different tab, in a different mental model. So you check it less than you should, and the test runs a week longer than it needed to.
We built the Badgerlytics dashboard with two tabs. One is the dashboard you expect. The other is the one we wish every tool had.
Tab one: Overview
The Overview tab is the daily health check, scoped to whatever date range you pick.
- Live activity — current active sessions, conversions in the past hour, and conversion revenue in the past hour.
- Traffic — sessions and pageviews, each with a sparkline and a View trend action that opens the full time series.
- Engagement — bounce rate, average page load, session duration, and returning visitors.
- Conversions & revenue — conversions, conversion rate, total revenue, and average order value for the range.
- Recurring revenue — net new MRR, expansion MRR, churned MRR, and net revenue churn when SaaS reporting is turned on for the property.
Two extras sit above the tiles:
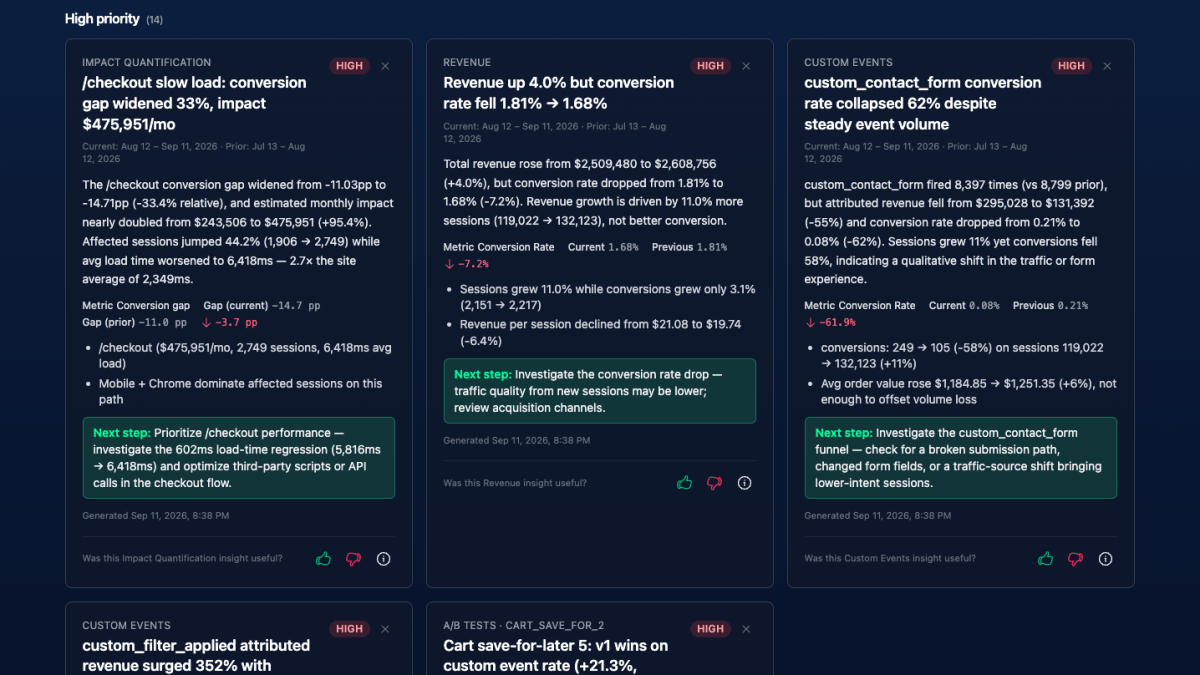
- AI Insight highlights — the top observations from the latest scheduled AI Insights run.
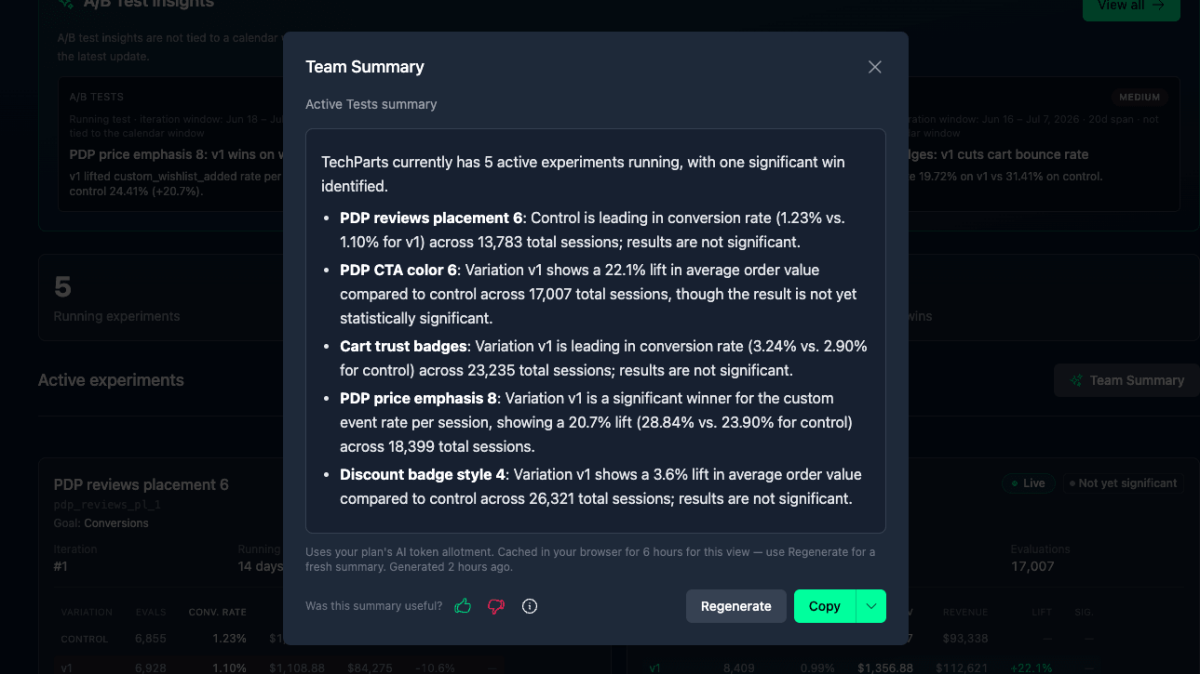
- Team Summary — a button that turns the numbers on screen into a copy-ready update for Slack or email. More on that in our Team Summaries post.
Tab two: Active Tests
This tab only shows up when at least one experiment is running. When it does, it becomes the page most teams live on.
Each running test gets a card. On the card:
| What you see | Why it matters |
|---|---|
| Every variation next to control | No hunting through a separate experiments product |
| Evals, Conv. rate, AOV, Revenue, Goal rate, Lift, Sig. per variation | The winning metric you chose and the revenue context around it |
| A Significant win / Significant loss / Not yet significant badge | Against control on the assigned goal, at p < 0.05 |
| A one-line verdict — which variation is leading, on what goal, by how much | The sentence you'd otherwise write in Slack |
| Iteration, running time, and a Bandit badge when traffic is auto-optimizing | Context for whether the numbers are mature |
| View full results | Jumps to the A/B Testing reports tab for that test |
Above the cards: an A/B Test insights panel with AI observations that apply only to running tests, plus tiles for running experiments, total evaluations, and significant wins. The Team Summary button here summarizes the current iteration of each live test instead of the date range.
Why this matters more than it sounds
- You check tests more often because they're one click from the numbers you already look at.
- You stop tests sooner because "Not yet significant" is right there, instead of a percentage that tempts you to call it early.
- Revenue is never hidden. A variation can win on conversion rate and lose on average order value. Both are on the card, so you see the trade-off before you ship.
Where to go deeper
The dashboard is the summary. When you want the full picture:
- The A/B Testing tab in Reports has Test Summary, Focus Page Analysis, and enrollment diagnostics — see the reporting deep dive.
- How tests are set up, bucketed, and iterated: Feature Flags docs.
- Setting up your first experiment: How-to: A/B test.
If your current dashboard has never once mentioned an experiment, that's the gap we're filling.
Quick answers
- What does the Badgerlytics dashboard show?
- The Overview tab shows live activity, traffic, engagement, conversions and revenue (plus recurring revenue for SaaS properties) for a chosen date range, with AI Insight highlights and a Team Summary button. The Active Tests tab shows a card for every running A/B test with per-variation evaluations, conversion rate, AOV, revenue, goal rate, lift, and significance.
- Where do I see my running A/B tests in Badgerlytics?
- On the property dashboard, open the Active Tests tab. It appears automatically whenever at least one experiment is running and shows each test's variations side by side against control.
- How does Badgerlytics show whether a test is winning?
- Each running test on the Active Tests tab is badged "Significant win", "Significant loss", or "Not yet significant" against control on its assigned goal, using a p < 0.05 threshold, with a plain-language line such as which variation is leading and by how much.