4 min read
Twenty-four reports, zero drag-and-drop
A tour of every Badgerlytics report — traffic, engagement, revenue, SaaS, and A/B testing — and the filters, comparisons, and CSV exports that come with each one.
There are two kinds of analytics tools. The kind where you build every report from a blank canvas, and the kind where the reports already exist and you just pick a date range.
We are firmly the second kind. Here is what you get the moment the tracking script is live.
How every report works
The controls are the same everywhere, so once you've used one report you've used them all:
- Date range — last 7, 30, 90 days or a custom span. Most reports also offer a daily breakdown view.
- Compare to previous — the prior period sits next to the current one with the change called out.
- Device comparison — desktop, mobile, and tablet side by side on reports that support it.
- Filters — new vs returning visitors, device type, country, page path, and more depending on the report.
- A/B test breakout — on most reports, pick a running or stopped test and see each variation as its own row. Lift and significance columns appear when a control arm exists.
- Group by — fan a report out by another dimension (referrer source, UTM campaign, event metadata, page path).
- CSV export — every table, one click.
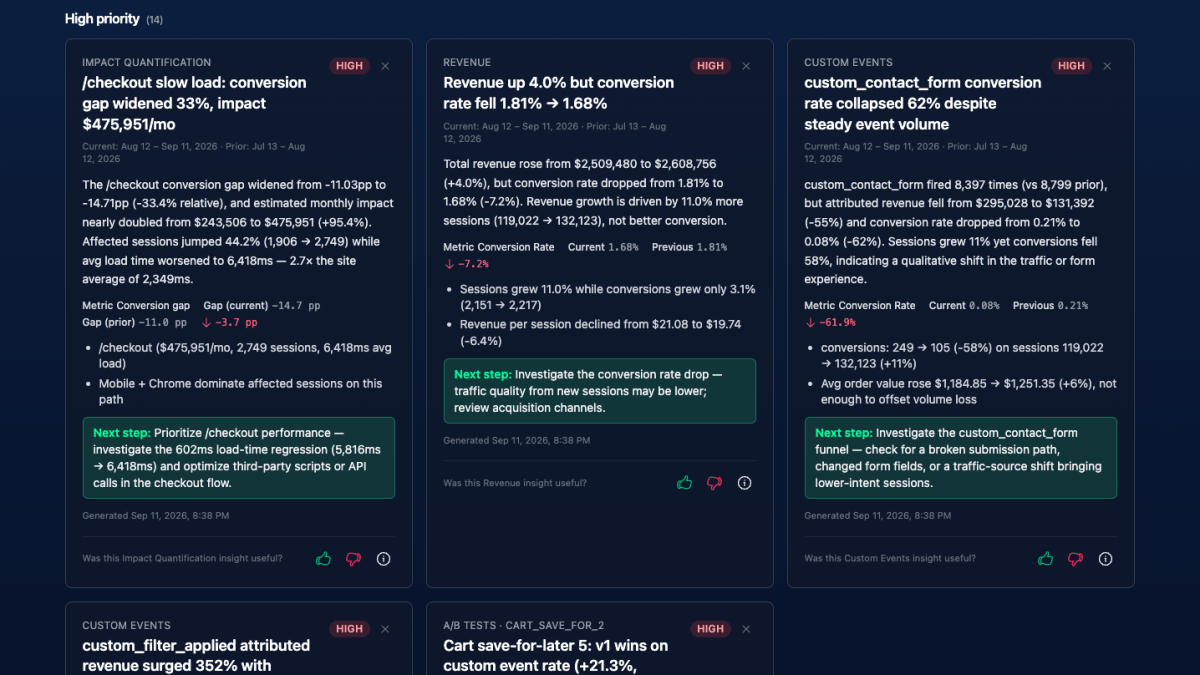
- AI insights strip — the latest scheduled observations for that report, collapsed above the data.
No sampling, either. Every event we receive is counted, so the numbers are exact rather than estimated. Details in Accuracy / sampling.
Traffic tab
| Report | What it answers |
|---|---|
| Website Performance | The top-line health check: traffic, engagement, and conversion as a time series (hourly to monthly) or a rollup |
| Device Performance | Desktop vs mobile vs tablet on traffic share, engagement, conversions, and revenue, side by side |
| Page Performance | Per-page traffic, time on page, scroll depth, bounce, and load time; compare up to 10 paths at once |
| Referrer & UTM Performance | Which sources and campaigns drive conversions and revenue, not just visits |
| Exit Pages | The last page people saw before leaving, with single-page exit rate |
| Browser Usage / OS Usage | Sessions, bounce, conversions, and time on site by browser family or operating system |
| Country Performance | Traffic, engagement, and conversion by country to spot strong and weak markets |
Engagement tab
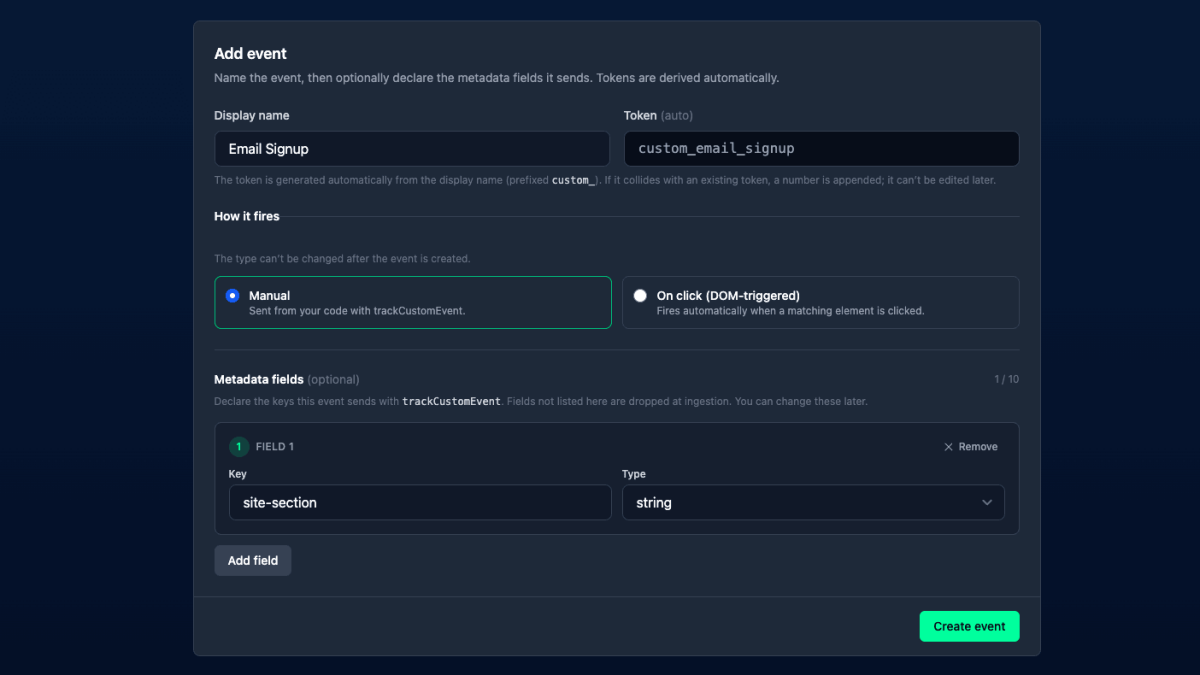
- Custom Events — volume and per-visit rate for every event you've registered, with group-by on A/B flag, page path, or any metadata key. Deep dive in our Custom Events post.
- Conversion Funnel — step-by-step counts and step-to-step conversion for the funnels you define.
- Impact Quantification — estimated revenue lost to slow pages, JavaScript errors, and rage clicks, ranked by monthly opportunity. This one gets its own article.
Revenue & Commerce tab
- Revenue — order value, discounts, taxes, shipping, revenue per visitor and per session, order-value distribution (median, p90), and an A/B breakout.
- Product Performance — revenue, units, and how often each product appears in larger orders.
- Product View Performance — views, unique viewers, and average price. Pair it with Product Performance to find popular-but-not-selling products.
- Category Revenue Performance — Product Performance rolled up by category.
- Cart Abandonment — carts that didn't become orders, the value left behind, and recovery within the window.
Setup for these lives in Ecommerce Reporting Setup and the How-tos.
SaaS tab
Shown when SaaS reporting is enabled on the property.
- MRR Performance — new, expansion, contraction, churn, and reactivation MRR, with running MRR/ARR, active subscribers, and ARPU in the daily view.
- Usage Revenue — usage-based and pack charges recognized at invoice time, broken down by usage item and plan. Independent of MRR.
- Subscription Lifecycle — counts of starts, upgrades, downgrades, cancels, reactivations, and renewals, with the MRR each one moved.
- Cohort Retention — group customers by first-paid month and watch how each cohort holds up.
- Cancellation Reasons — ranked by volume and lost MRR.
Wiring: SaaS Reporting Setup, including the lifecycle webhook and usage charge webhook.
A/B Testing tab
- Test Summary — one card per test with status, headline conversion and revenue, the leader vs control, and a per-variation rollup. Scope it to the current iteration, a specific one, or all of them.
- Focus Page Analysis — per-page traffic, time on page, scroll depth, and bounce for the pages you flagged on the test, split by variation.
- Variant Enrollment vs Exposure — a diagnostic that compares who was assigned a variation to who actually saw it. Catches bucketing bugs before they cost you a test.
How tests get set up: Feature Flags docs and the A/B testing post.
The point
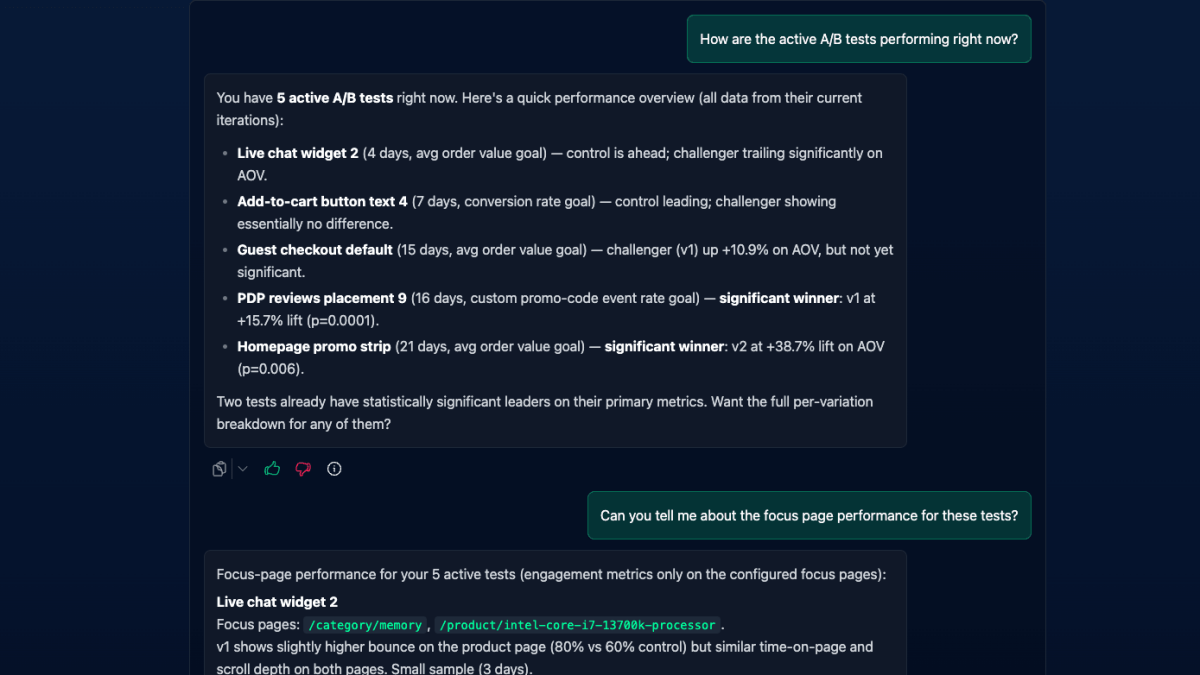
You shouldn't need a data team to answer "which campaign made money on mobile last month." Pick the Referrer & UTM report, filter to mobile, turn on compare, done. If a question really doesn't fit a report, ask the AI Chat Analyst — it queries the same data.
Plan details and session allowances are on the pricing page.
Quick answers
- What reports does Badgerlytics include?
- Twenty-four reports across five tabs — Traffic (Website Performance, Device Performance, Page Performance, Referrer & UTM, Exit Pages, Browser Usage, OS Usage, Country Performance), Engagement (Custom Events, Conversion Funnel, Impact Quantification), Revenue & Commerce (Revenue, Product Performance, Product View Performance, Category Revenue, Cart Abandonment), SaaS (MRR Performance, Usage Revenue, Subscription Lifecycle, Cohort Retention, Cancellation Reasons), and A/B Testing (Test Summary, Focus Page Analysis, Variant Enrollment vs Exposure).
- Do I need to build reports in Badgerlytics?
- No. Every report is pre-built and available as soon as the tracking script is installed. You choose a date range, filters, and optional group-by or A/B test breakouts rather than assembling charts by hand.
- Does Badgerlytics sample analytics data?
- No. Every event the tracking script sends is counted. Conversion rates and revenue figures are exact, not extrapolated.