3 min read
Impact Quantification: put a price on friction
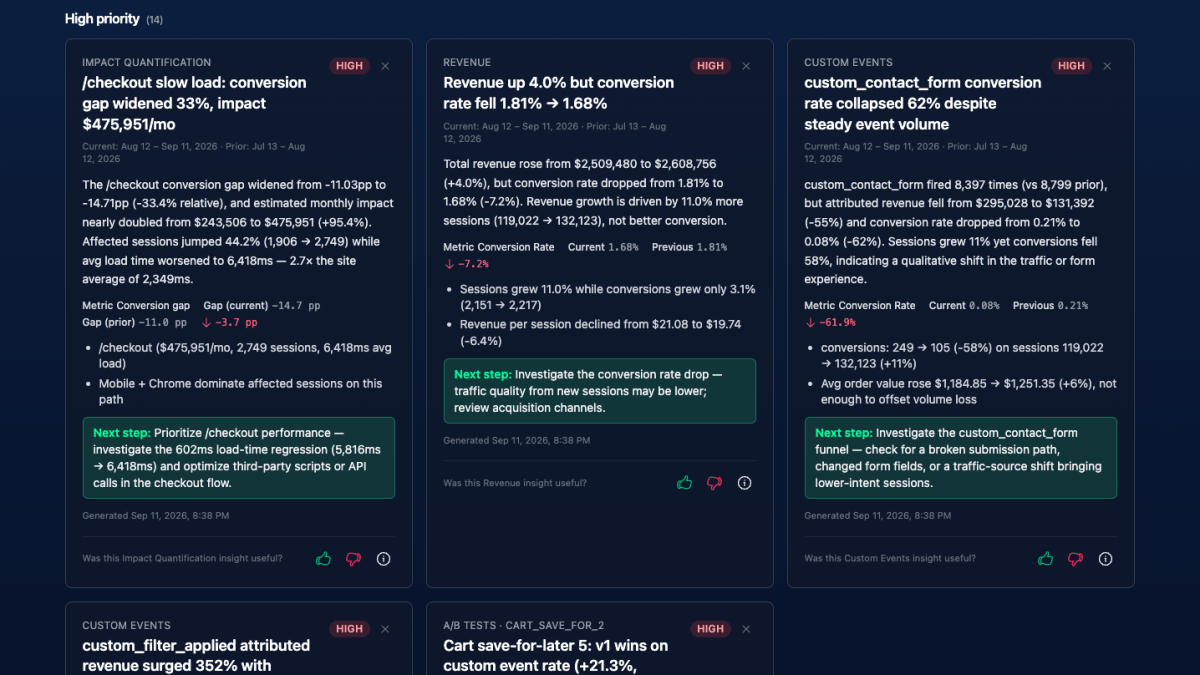
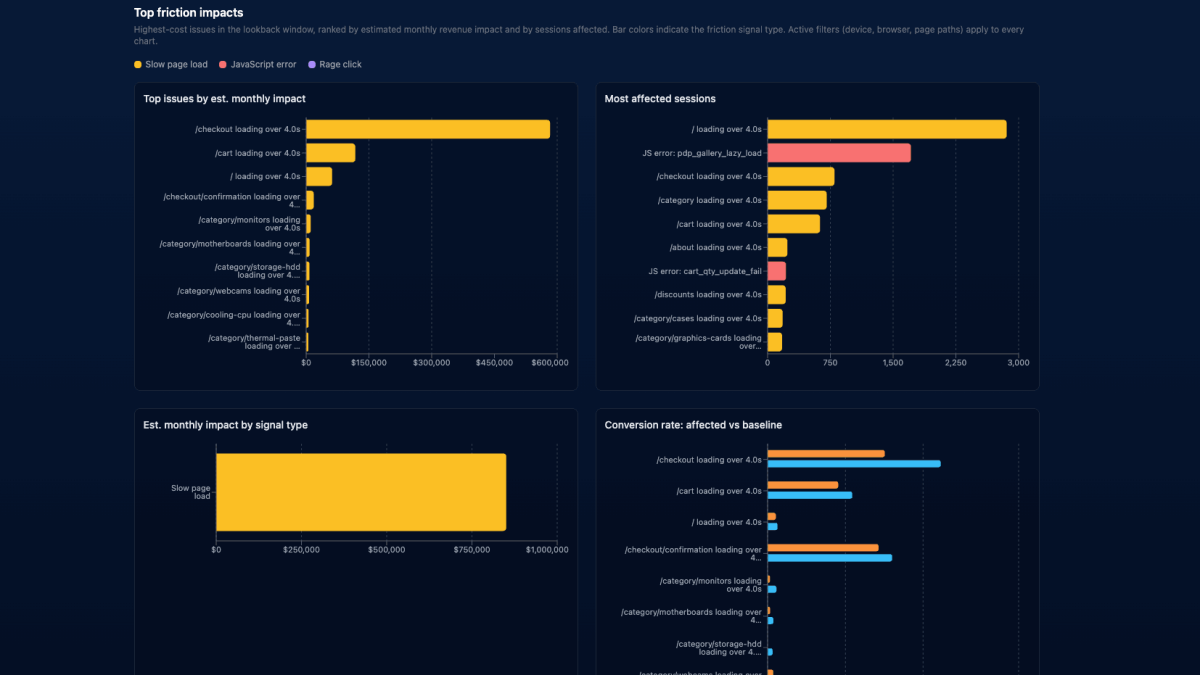
The report that estimates how much revenue slow pages, JavaScript errors, and rage clicks are costing you each month, ranked so you fix the expensive one first.
3 min read
The report that estimates how much revenue slow pages, JavaScript errors, and rage clicks are costing you each month, ranked so you fix the expensive one first.
3 min read
Scheduled AI observations across traffic, revenue, devices, custom events, and running A/B tests, ranked by priority and shown on the dashboard, the reports, and one feed.
3 min read
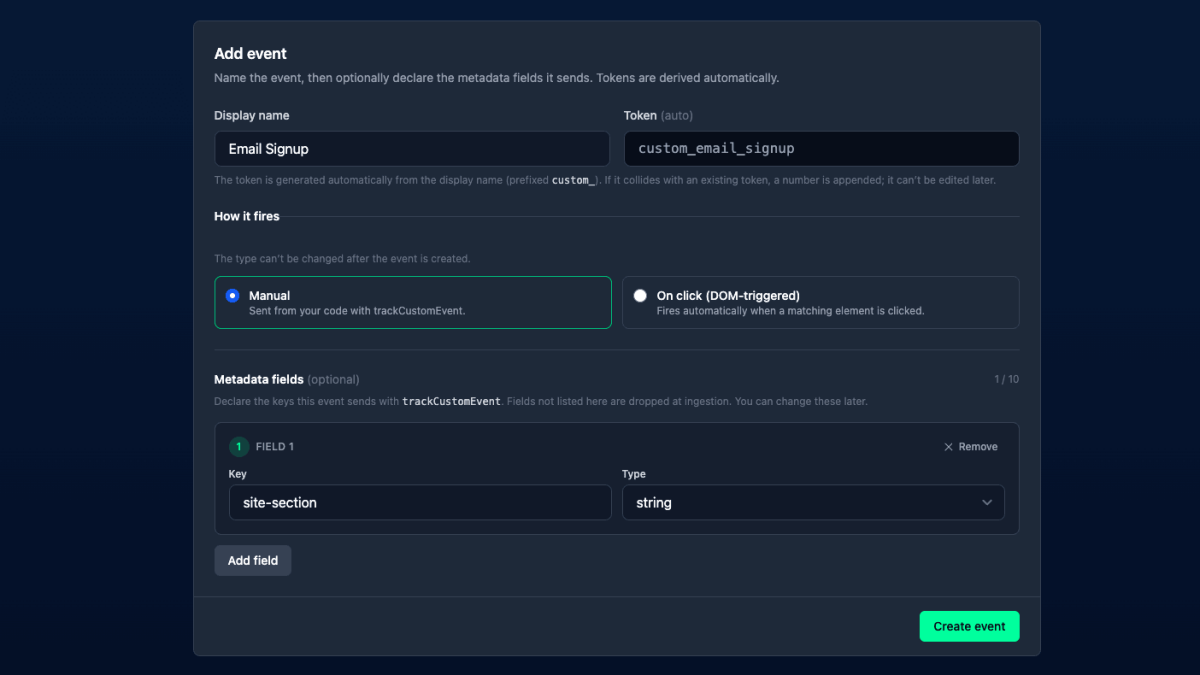
Register an event, fire it from code or a click, attach metadata, and use it as a funnel step, an audience rule, or the winning metric of an A/B test.
4 min read
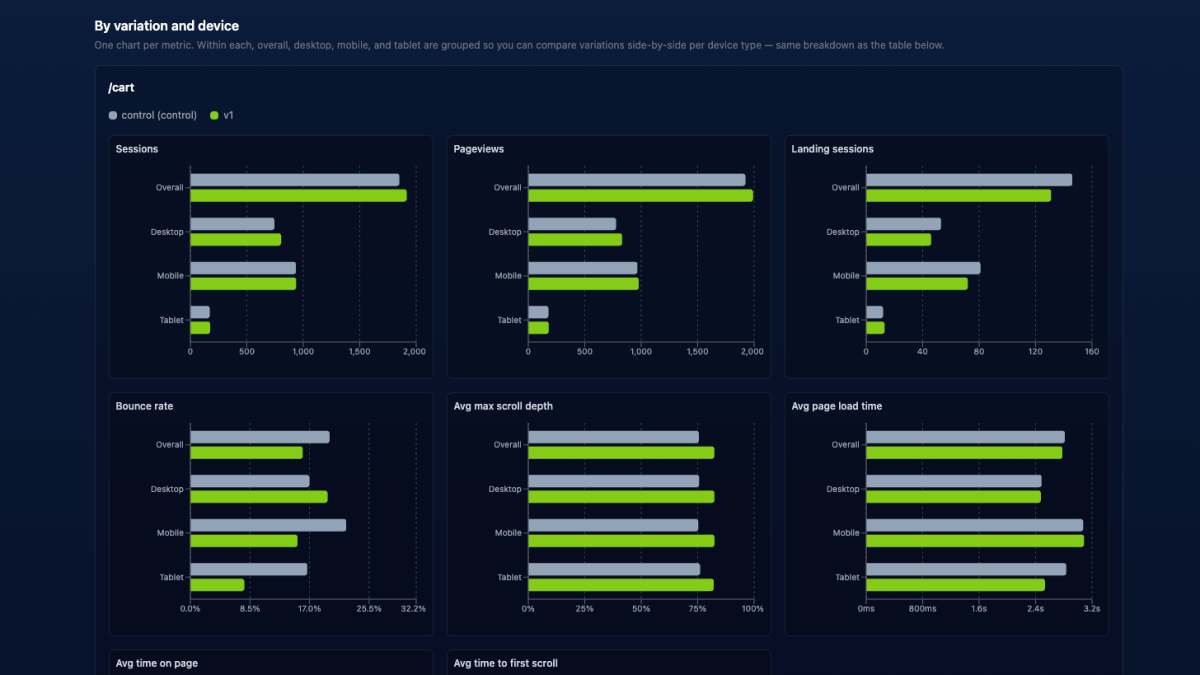
A tour of every Badgerlytics report — traffic, engagement, revenue, SaaS, and A/B testing — and the filters, comparisons, and CSV exports that come with each one.
3 min read
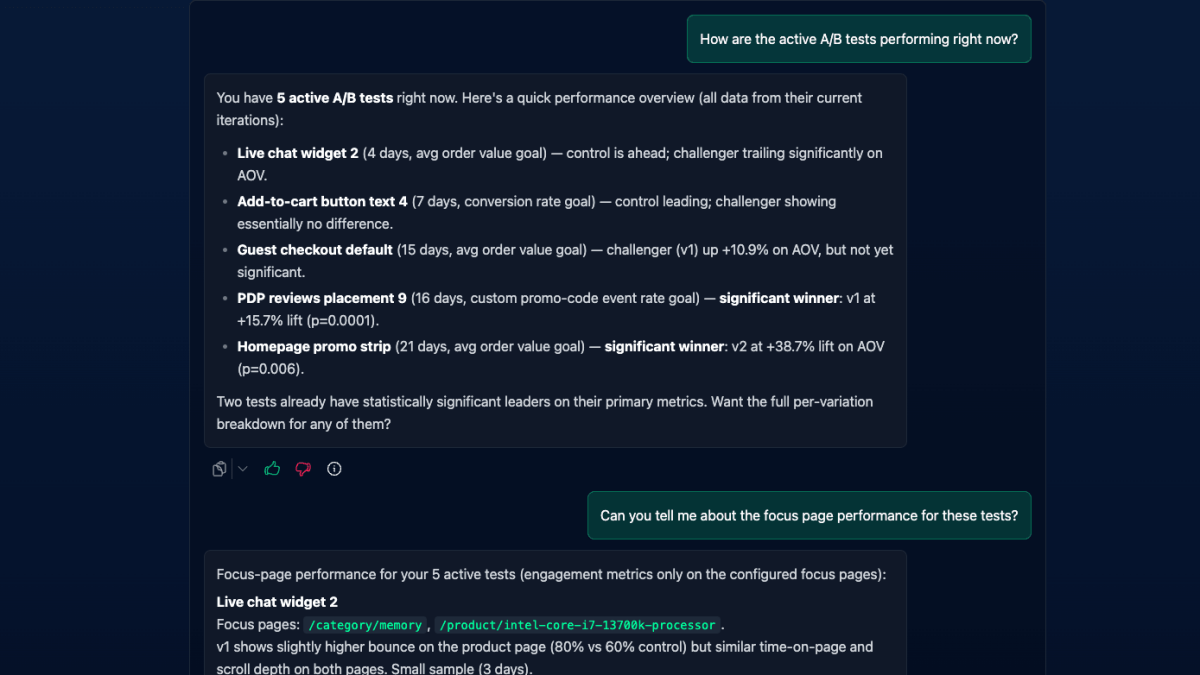
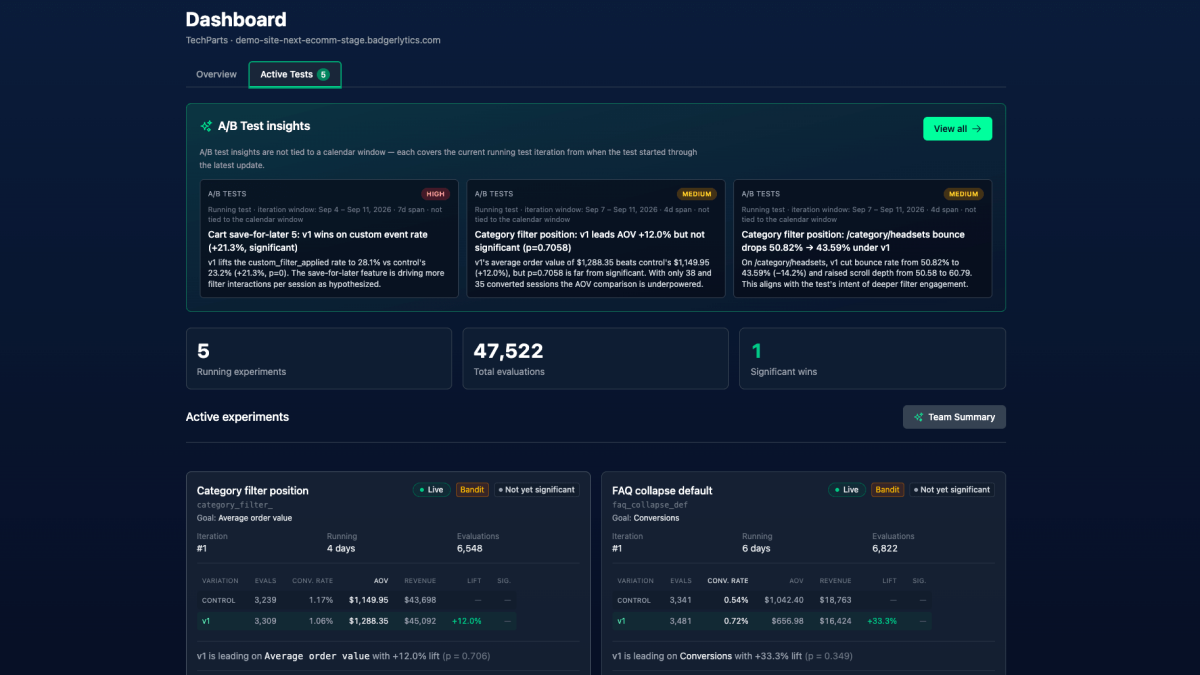
Most analytics dashboards forget you run experiments. Ours has an Active Tests tab that shows every live A/B test, its leader, and whether the result is real yet.
Join the teams using Badgerlytics to grow revenue, run smarter experiments, and finally understand their funnels.
Cancel anytime.