3 min read
A/B tests and feature flags: same switch, different jobs
How Badgerlytics experiments and feature flags work — winning metrics, multi-armed bandit traffic, focus pages, iterations, and results that live next to your revenue data.
A feature flag and an A/B test are the same piece of plumbing pointed at two different questions. Should this be on? versus Which version is better? Badgerlytics gives you one switch that answers either.
Two types, one setup screen
When you create a flag you pick a type. The labels match the app:
| Type | Arms | Use it for |
|---|---|---|
| Experiment (A/B/C) | control, v1, v2, … with custom splits | Hypothesis testing, significance, picking a winner |
| Feature flag (on/off) | control (off), v1 (on) with weights | Ramping a feature, kill switches, gradual rollouts |
Both bucket a visitor once and remember it. Every event we collect afterward knows which variation that visitor saw — which is why test results can be broken out by device, funnel step, or page in the reports without any extra wiring.
Setting up an experiment takes about two minutes
- Pick a flag key (
hero_test). That's the identifier your code references. - Define variations and the traffic split.
- Choose a winning metric.
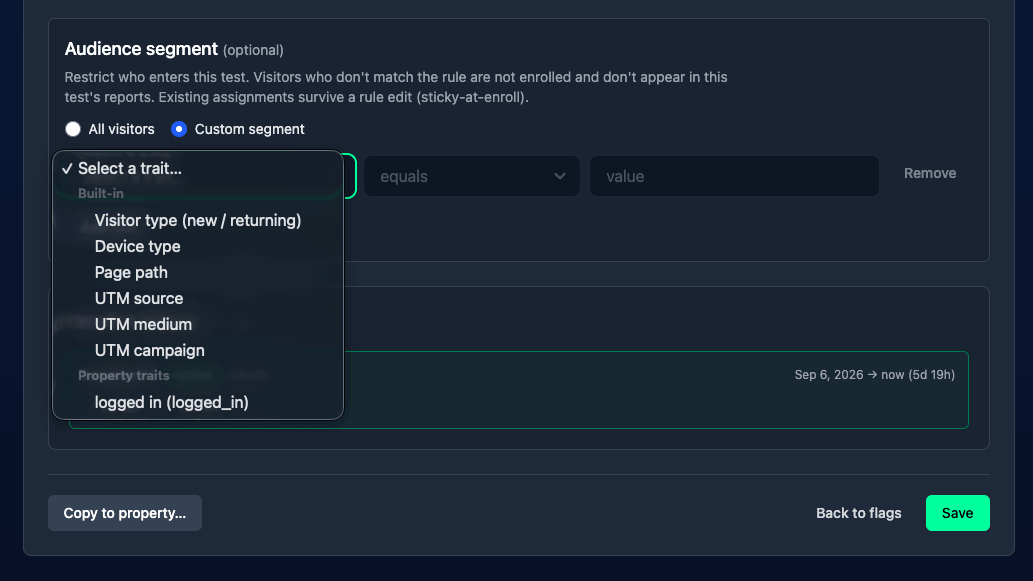
- Optionally add focus pages and an audience segment.
- Hit Start.
Pick the metric the test is actually about
Every experiment is judged on one winning metric:
- Conversion rate — share of sessions that completed a built-in conversion. The default.
- Average order value — for bundles, upsells, and free-shipping thresholds, where you care about spend per order more than order count.
- A custom event — per-session rate of anything you track: signups, add-to-cart, demo requests. See Custom Events.
Whatever you pick, results still show conversion and AOV wherever revenue exists. Only the leader and significance follow your chosen metric.
Fixed split or let the bandit drive
- Fixed weights — a clean 50/50 (or whatever you set) for the whole run. Best for measuring lift precisely.
- Multi-armed bandit — traffic shifts toward the variations leading on your winning metric. Weights adjust twice a day, gradually and capped per cycle, and stay put until there's enough data to be confident. Trigger an optimization yourself any time, or hit the kill switch to send everyone to control without losing data.
Focus pages: per-page results for a site-wide test
Add up to 10 exact paths (/checkout, /products/widget) and each gets pageviews, sessions, bounce, and engagement broken out by variation in the Focus Page Analysis report. Testing a change that touches many pages? Treat the list as a sample of the pages that matter most.
Iterations keep the audit trail
A test comes back inconclusive and you want to try a tweak. Start a new iteration on the same flag: visitors are re-bucketed, the old results stay intact, and every iteration is reported separately. Test Summary can show the current iteration, a specific one, or every iteration on its own row.
The code side, briefly
Client-side, wait for the script to be ready and read the variation:
document.addEventListener('badgerlytics:ready', function () {var variation = window.badgerlytics.getVariation('hero_test');if (variation === 'v1') {document.body.classList.add('hero-test-v1');}});
React apps get hooks:
import { useVariation, useIsFlagEnabled } from '@badgerlytics/sdk/react';function Hero() {const variation = useVariation('hero_test', 'control');const newPricing = useIsFlagEnabled('new_pricing_table');return (<>{variation === 'v1' ? <HeroB /> : <HeroA />}{newPricing && <PricingV2 />}</>);}
Server-rendered frameworks (Next.js, Remix, Nuxt, Astro) bucket visitors in middleware so there's no flicker — see SSR middleware and the per-framework snippets under Feature Flags.
When the test is done
Stop freezes bucketing but keeps every result. From there: ship the winner (the flag always returns that variation while you remove the old code), start a new iteration, or archive.
Where results show up
- The Active Tests tab on the dashboard — every live test with its leader and significance marker.
- The A/B Testing reports tab — Test Summary, Focus Page Analysis, and Variant Enrollment vs Exposure.
- Nearly every other report via the A/B test breakout — "revenue per session for
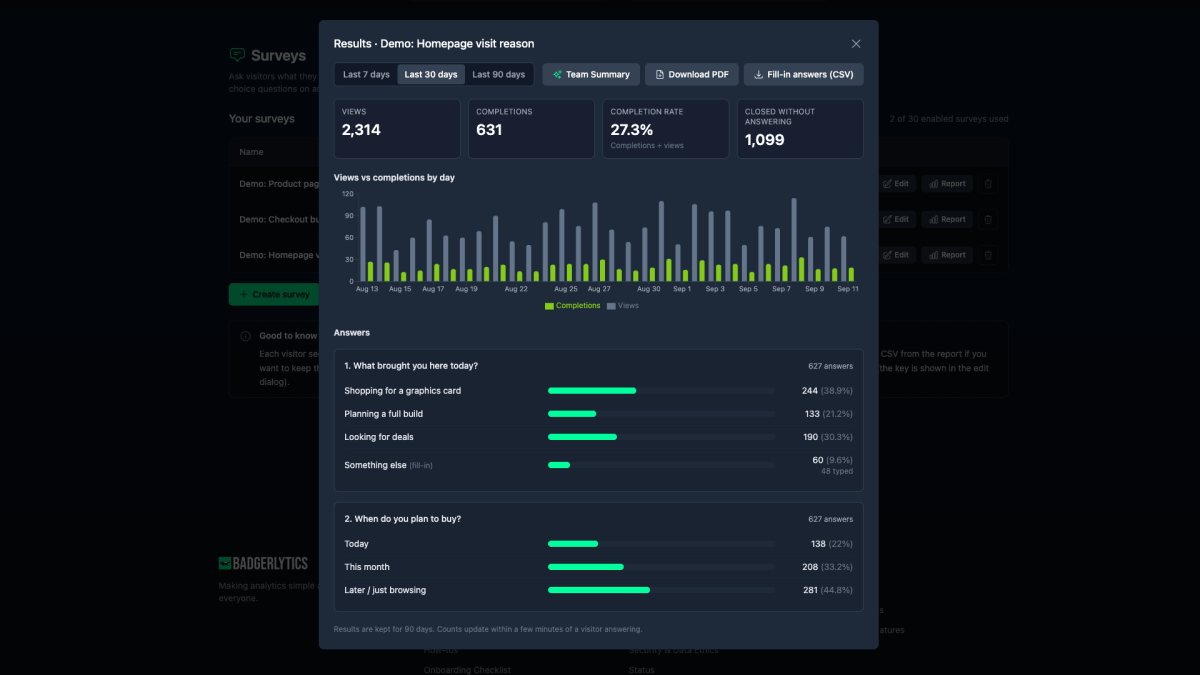
v1on mobile" is a filter, not a project. - Click Maps and Surveys can both be scoped to a variation.
Plan limits on running flags: Starter 5, Pro 15, Business 30, Ultimate 35 per property. Full details on the pricing page and in Plan limits.
Step-by-step setup: How-to: A/B test and How-to: Feature flag. If you're weighing us against a dedicated experimentation tool, the Optimizely, VWO, and LaunchDarkly comparisons are candid about the differences.
Quick answers
- What is the difference between an experiment and a feature flag in Badgerlytics?
- An Experiment (A/B/C) compares two or more variations against control with a winning metric, significance, and a leader. A Feature flag (on/off) ramps a feature up or down with weights and is checked in code with isFlagEnabled(). Both use the same bucketing and every analytics event records which variation the visitor saw.
- What winning metrics can a Badgerlytics A/B test use?
- Conversion rate (default), average order value, or the per-session rate of any custom event such as signups or add-to-cart.
- Does Badgerlytics support multi-armed bandit testing?
- Yes. Choose multi-armed bandit traffic optimization and weights auto-adjust twice a day toward the variations leading on your chosen winning metric. You can also trigger an optimization manually or hit a kill switch to send everyone to control.
- How many A/B tests can run at once?
- It depends on plan — 5 running flags per property on Starter, 15 on Pro, 30 on Business, and 35 on Ultimate.