3 min read
Impact Quantification: put a price on friction
The report that estimates how much revenue slow pages, JavaScript errors, and rage clicks are costing you each month, ranked so you fix the expensive one first.
"The checkout page is slow" is an engineering ticket. "The checkout page is slow, and here's the monthly revenue it's costing" is a priority. Impact Quantification turns the first sentence into the second.
We call this one out separately from the other reports because it does something different: it doesn't describe traffic, it estimates money you're not collecting.
Three kinds of friction
| Signal | What we look for |
|---|---|
| Slow pages | Pages loading above a threshold (adjustable), compared with the site-wide average |
| JavaScript errors | Errors grouped by fingerprint, with a sample message and the page they hit |
| Rage clicks | Bursts of repeated clicks on one element, with its selector and visible label |
Each becomes a row. A site-wide guardrail row also appears when most pages are slow, so a global performance problem isn't hidden inside twenty page-level ones.
How the estimate works
For every issue the report compares two groups within the lookback window:
- Exposed — sessions that hit the slow page, saw the error, or rage-clicked
- Baseline — sessions that didn't
Then it reports the gap:
- Conversion rate, exposed vs baseline, and the delta
- Revenue per session, exposed vs baseline
- Estimated impact for the window, applied to the affected volume
- Estimated monthly impact — the same figure scaled to 30 days, which is the column the ranking uses
Alongside each row: affected sessions and their share of traffic, raw occurrences, average load time next to the site average (for slow pages), and the top device and top browser among affected sessions — so "this only breaks on Safari on iPhone" is visible without another report.
It's an estimate, and we label it that way. Exposed sessions may differ from baseline sessions for reasons other than the friction. But it's a far better ranking signal than "which error has the most occurrences."
Controls
- Lookback — 7, 30, 60, or 90 days (fixed buckets rather than arbitrary ranges, so the extrapolation stays honest).
- Slow-page threshold — adjust what counts as slow for your site.
- Device and browser filters — narrow every row to one slice.
- Page paths — focus on up to 10 paths.
- A/B test breakout — pick a test and see each variation's friction rate against control, with the delta. A variation that shipped a heavier hero image shows up here before it quietly loses the test.
Summary chips at the top show total sessions, days with data, and the site-wide average load time so the numbers have context.
From a row to a recording
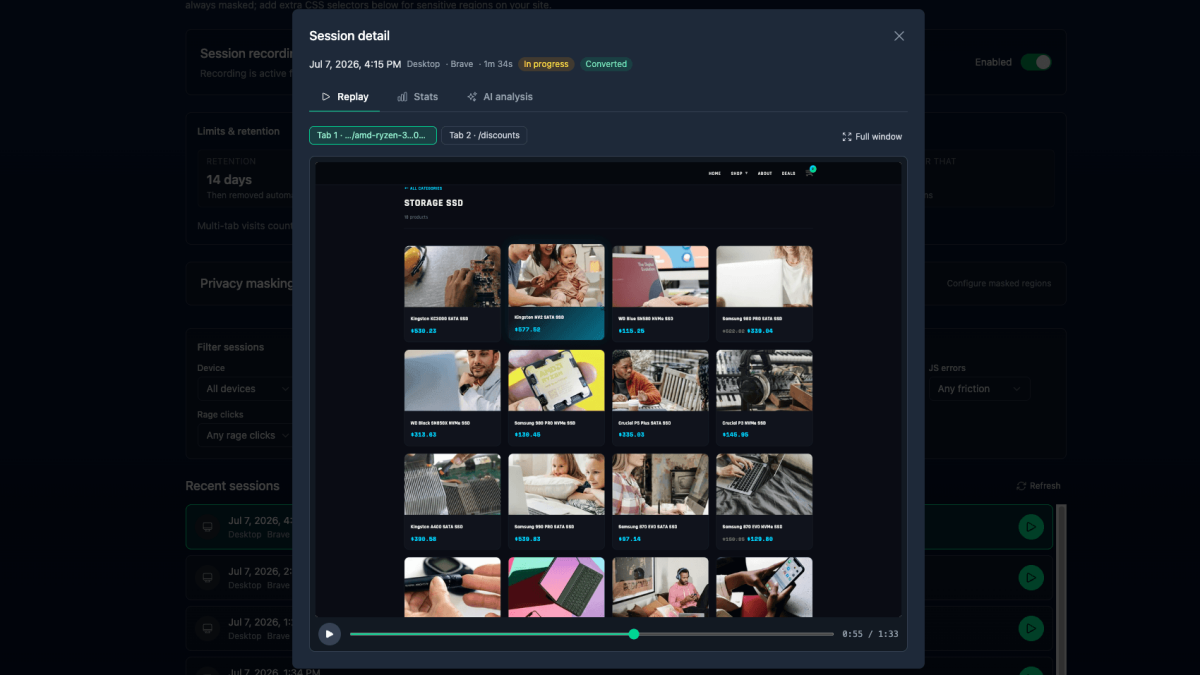
On plans with AI Session Replay, each issue links straight to the matching recordings — sessions on that page, sessions with errors, or sessions with rage clicks. You read the estimate, click, and watch the three visitors it happened to. That loop is the whole point.
It feeds the rest of the platform
- AI Insights can analyze this report on its schedule and flag a new high-cost issue.
- Team Summary works on report pages too, so the weekly "what's costing us money" recap is one click.
- Every table exports to CSV for the engineering ticket.
Where to find it
Reports → Engagement → Impact Quantification. It uses the same pageview, error, and click data the tracking script already sends — nothing extra to install.
Performance and error data are only as complete as what the browser delivers; the usual accuracy caveats apply. Pair it with the Page Performance report when you want load-time detail per page without the revenue lens.
Quick answers
- What does the Impact Quantification report do?
- It finds three kinds of friction — slow page loads, JavaScript errors, and rage clicks — measures how sessions exposed to each one convert and spend compared with unexposed sessions, and estimates the revenue opportunity per issue, extrapolated to a monthly figure and ranked.
- How is the revenue impact estimated?
- For each issue, the report compares conversion rate and revenue per session among exposed sessions against the baseline of sessions that didn't hit it, then applies that gap to the affected volume over the lookback window (7, 30, 60, or 90 days) and scales it to 30 days.
- Can Impact Quantification compare A/B test variations?
- Yes. Select a test and the report compares friction rates on each variation against control, so you can catch a variation that introduced a slow page or a new error before it hurts the result.