7 min read
Why Badgerlytics does experimentation better
Experiments live next to your revenue, not in a separate tool. Pick the winning metric that matches the hypothesis, read results in every report, and force any variation from a Chrome extension when you're QAing.
Dedicated experimentation tools are good at running tests and bad at telling you what the test did to the business. Analytics tools are the opposite. So most teams run both, then spend Thursday afternoon stitching a spreadsheet.
That's the gap. Not "can we bucket visitors." Everyone can bucket visitors.
Badgerlytics runs the experiment on the same data as the rest of the product. The variation a visitor saw is on every event we collect. Revenue, funnels, click maps, surveys, replay - they already know which arm they came from. You stop exporting. You start deciding.
A lot of feature flag platforms don't even have a built-in way to show whether a test is a winner or loser, or charge a premium for it. It's all included with Badgerlytics. You can even use custom events as a test metric. And you're not stuck with A vs B - add more variations and you've got a multivariate test (up to five arms, including control).
Focus Pages
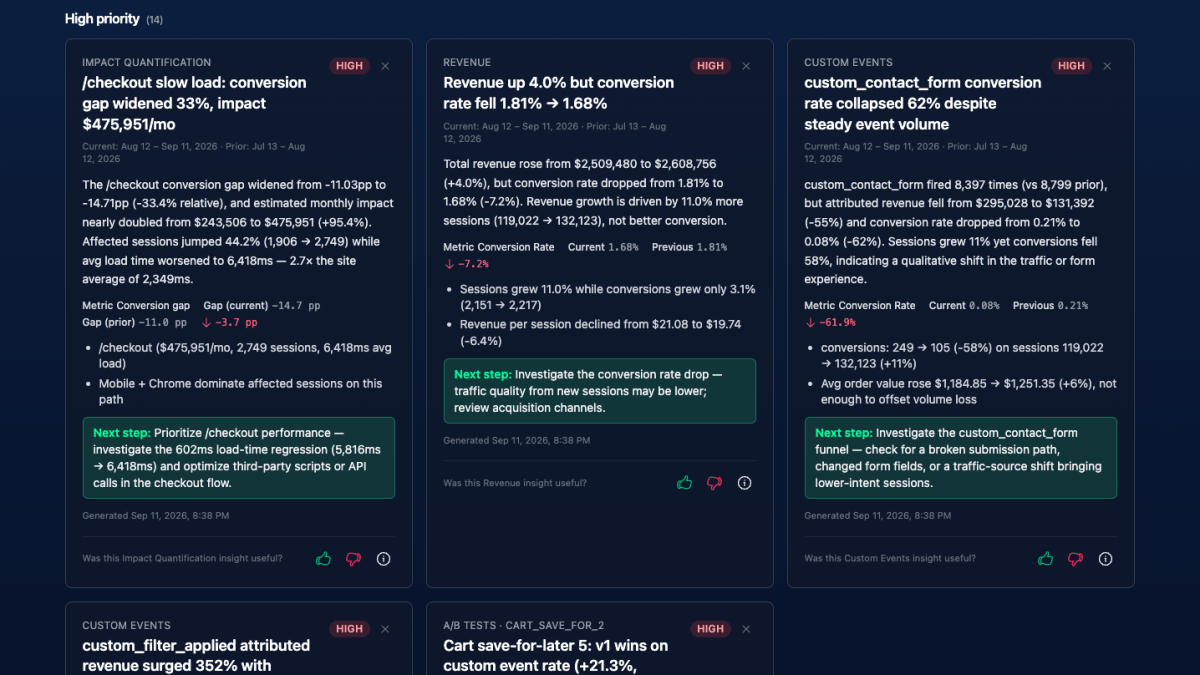
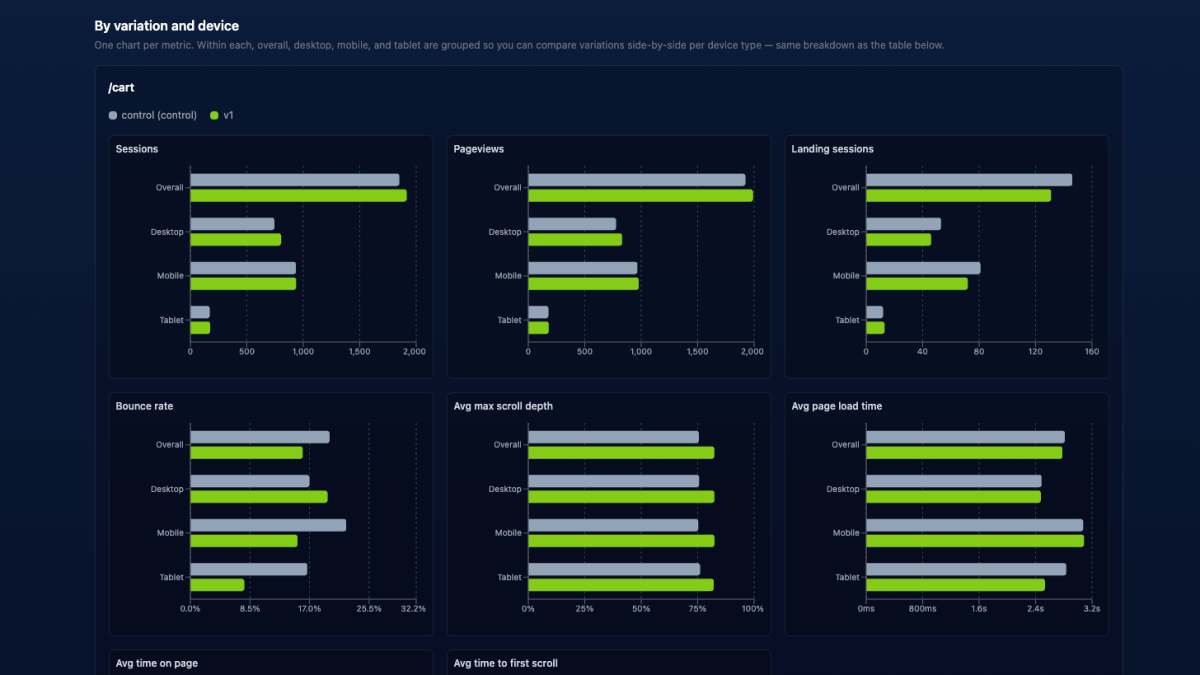
The thing we do nobody else does is focus pages. A lot of tests are engagement-focused and to get a drill down on a sample of the most important pages for the test requires a lot of work, dragging and dropping report metrics (ugg). And whatever AI chat feature they have won't know which pages are important. With the AI Chat Analyst, you can ask questions like, "How are the focus pages for the category_redesign_test performing?". It's that simple. Just include the test token in the question, so it doesn't trip up on a similarly named test. You'll get a great response that you can copy and paste and share with your team.
Active Tests Tab
Our favorite thing about experimentation in Badgerlytics is the Active Tests tab. No, you don't need to do 5 clicks and a bunch of dragging and dropping to figure out how the test is performing, it's right there when you login. Just click on "Active Tests". All of your active tests, whether they are winners or losers, are there with a lot of valuable metrics like conversion rate and average order value.
Tooling
Another annoying thing about experimentation platforms is the tooling. Even with first class experimentation platforms, engineers often have to cobble together their own custom integrations - because the tooling isn't straightforward and doesn't work across multiple apps easily. And server-side tests? That's where it gets hard. Our SDK packages make it easy to do tests without that dreaded flash of content. And because Badgerlytics is an all-in-one platform, there's just a lot less integration to do.
Pricing concerns
A lot of platforms nickel and dime you on experimentation. You get charged for monthly active users and flag evaluations. That's not a game we want to be a part of. For one thing, most customers have no idea how much they're going to owe with usage-based billing. We don't charge separately for experiments or evaluations. It's all included in every plan. So you have a predictable bill regardless of the tests you run.
The test and the revenue are the same dataset
When a visitor is in v1, every pageview, purchase, custom event, and click from that session is tagged with v1. You don't configure a goal in one product and hope it matches a conversion in another. You pick a winning metric and the rest of the numbers are already there.
Where that shows up:
- The Active Tests tab on the dashboard - every live test, the leader, lift, and whether it's significant yet. Revenue and AOV sit on the same card as the goal, so a variation that wins on conversion and loses on order value is obvious.
- Nearly every report via the A/B test breakout - "revenue per session for
v1on mobile" is a filter, not a project. Details in the reporting tour. - Click Maps, Surveys, and AI Session Replay can all be scoped to a variation. You watch the layout people actually saw, not a blended average of both arms.
- The AI Chat Analyst already knows about your tests. Ask "compare conversion rate between control and v1 on the homepage hero test" and you get the same numbers as the report.
Most CRO stacks charge you extra to get halfway here, then ask you to export the other half.
Judge the test on the metric it's actually about
Every experiment has one winning metric:
- Conversion rate - share of sessions that completed a built-in conversion. The default.
- Average order value - for bundles, upsells, and free-shipping thresholds, where spend per order matters more than order count.
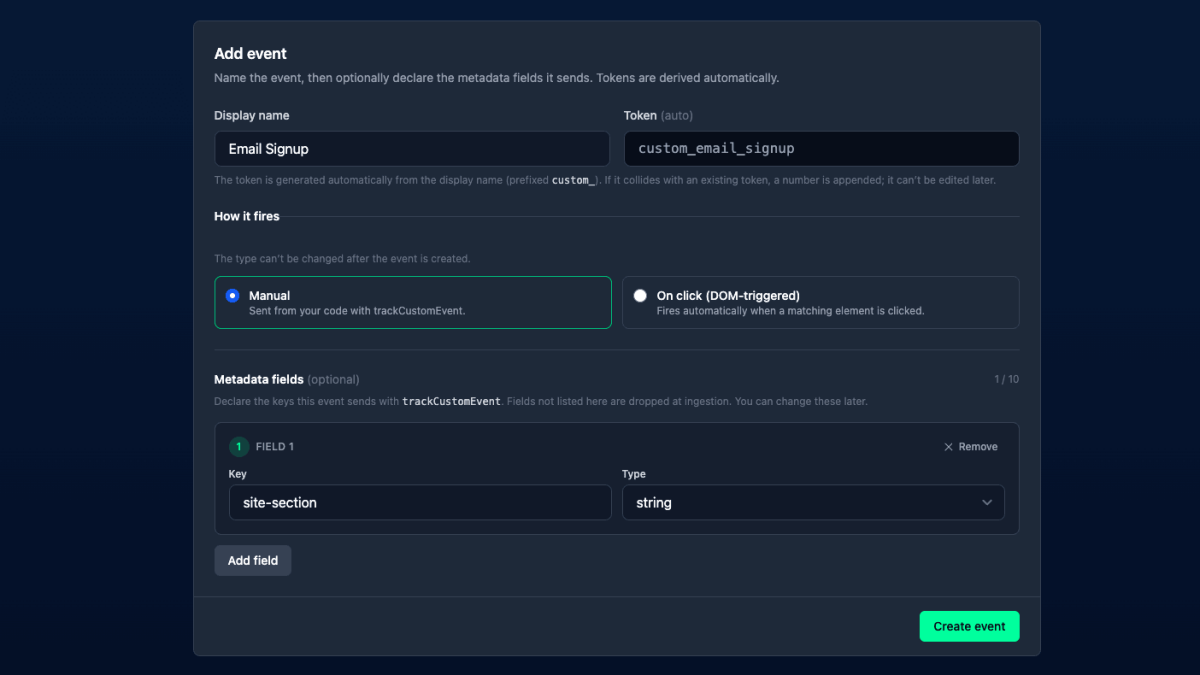
- A custom event - per-session rate of anything you already track. Signups, add-to-cart, demo requests. The event is the goal. You don't define it twice.
Whatever you pick, results still show conversion and AOV wherever revenue exists. Only the leader and significance follow your chosen metric. That's how you avoid shipping a "winner" that made more people buy a cheaper thing.
Fixed split or let the bandit drive
- Fixed weights - a clean 50/50 (or whatever you set) for the whole run. Best when you want a precise read on lift.
- Multi-armed bandit - traffic shifts toward the variations leading on your winning metric. Weights adjust twice a day, gradually and capped per cycle, and stay put until there's enough data to be confident. Trigger an optimization yourself any time.
If something looks broken, hit the kill switch. Everyone goes to control. The data stays. You didn't throw the test away, you paused the damage.
Test the people the change is for
A homepage test on everyone is fine. A pricing-page test for free-tier users is not "everyone." Add an audience segment so only matching visitors get bucketed. Everyone else sees control and isn't counted.
That's how you stop a good idea from looking flat because half the traffic was never the audience. Setup and examples in Personalized A/B tests.
Force the variation you're trying to QA
The part nobody talks about is checking that v1 actually looks like v1. Reloading until the cookie lands on the right arm is a waste of an afternoon.
We ship a free Chrome extension for this (an extension that doesn't suck, by the way). Install it in developer mode, open a page with the tracker, and use the Flags tab:
- See which variation you were assigned
- Pick another variation and Apply - the page reloads in that arm
- Force more than one test at once if they overlap
- Clear all when you're done
- Reset sticky cookies when you want a clean re-bucket instead of a force
Under the hood it writes ?bai_testForce=hero_test:v1 on the URL. You can paste that yourself. The extension is just faster. You can force several tests in one go: ?bai_testForce=hero_test:v1,pricing_test:control.
While you're there:
- The Events tab is a live feed of what the tracker is sending, so you can confirm the variation is actually on the events.
- Custom lets you fire a registered custom event with metadata - useful when that event is the winning metric.
- Traits lets you set or clear audience traits and re-evaluate, so a segmented test can be checked as the segment and as everyone else.
The extension does not send data to us. It's for your browser, on your sites. Forcing a variation is also how Click Maps line up the overlay with the layout on screen.
If you don't want office traffic in the results, block it under Settings → Traffic filters. Forcing a variation is for seeing the arm. Filters are for keeping your own clicks out of the numbers.
What we don't pretend to be
Variations live in code. There is no visual editor where a marketer paints a new headline onto the live page. If that's the job, Optimizely and VWO are built for it, and the comparisons are honest about it.
What you get instead is an experiment that already knows your revenue, your funnels, and your click maps - and a way to force the arm you're QAing without fighting the cookie.
When the test is done
Stop freezes bucketing and keeps every result. Ship the winner, start a new iteration, or archive.
Setup takes a couple of minutes: a test token, variations (A/B or multivariate), a winning metric, optional focus pages and an audience, then Start. Walkthrough: How-to: A/B test.
Plan limits on concurrent tests: Starter 5, Pro 15, Business 30, Ultimate 35 per property. Full details on the pricing page and in Plan limits.
Quick answers
- Why run A/B tests in Badgerlytics instead of a dedicated experimentation tool?
- Every analytics event already knows which variation the visitor saw, so test results show up next to revenue, funnels, click maps, surveys, and session replay - no export, no second login. You also get a published price and a 14-day trial instead of a sales-led contract.
- Can I force an A/B test variation for QA?
- Yes. The free Badgerlytics DevTools Chrome extension lets you pick a variation and reload the page in that arm. It writes ?bai_testForce=hero_test:v1 on the URL, the same parameter you can paste yourself. You can force more than one test at once and reset sticky cookies for a clean re-bucket.
- Can I do multivariate tests?
- Yes. An experiment isn't limited to A vs B. Add more variations and you're running a multivariate test - up to five arms, including control. Each arm gets the same winning metric, significance, and report breakouts as a two-way test.
- What winning metrics can a Badgerlytics A/B test use?
- Conversion rate (the default), average order value, or the per-session rate of any custom event you've registered, such as signups or add-to-cart. Results still show conversion and AOV wherever revenue exists. Only the leader and significance follow your chosen metric.
- Can I see A/B test results in other reports?
- Yes. Most reports have an A/B test breakout, so you can compare variations inside revenue, funnels, custom events, and more. Click Maps, Surveys, and AI Session Replay can also be scoped to a single variation.